step2point
A library for turning detailed calorimeter shower deposits into compact point-cloud representations usable for ML-based fast simulation.
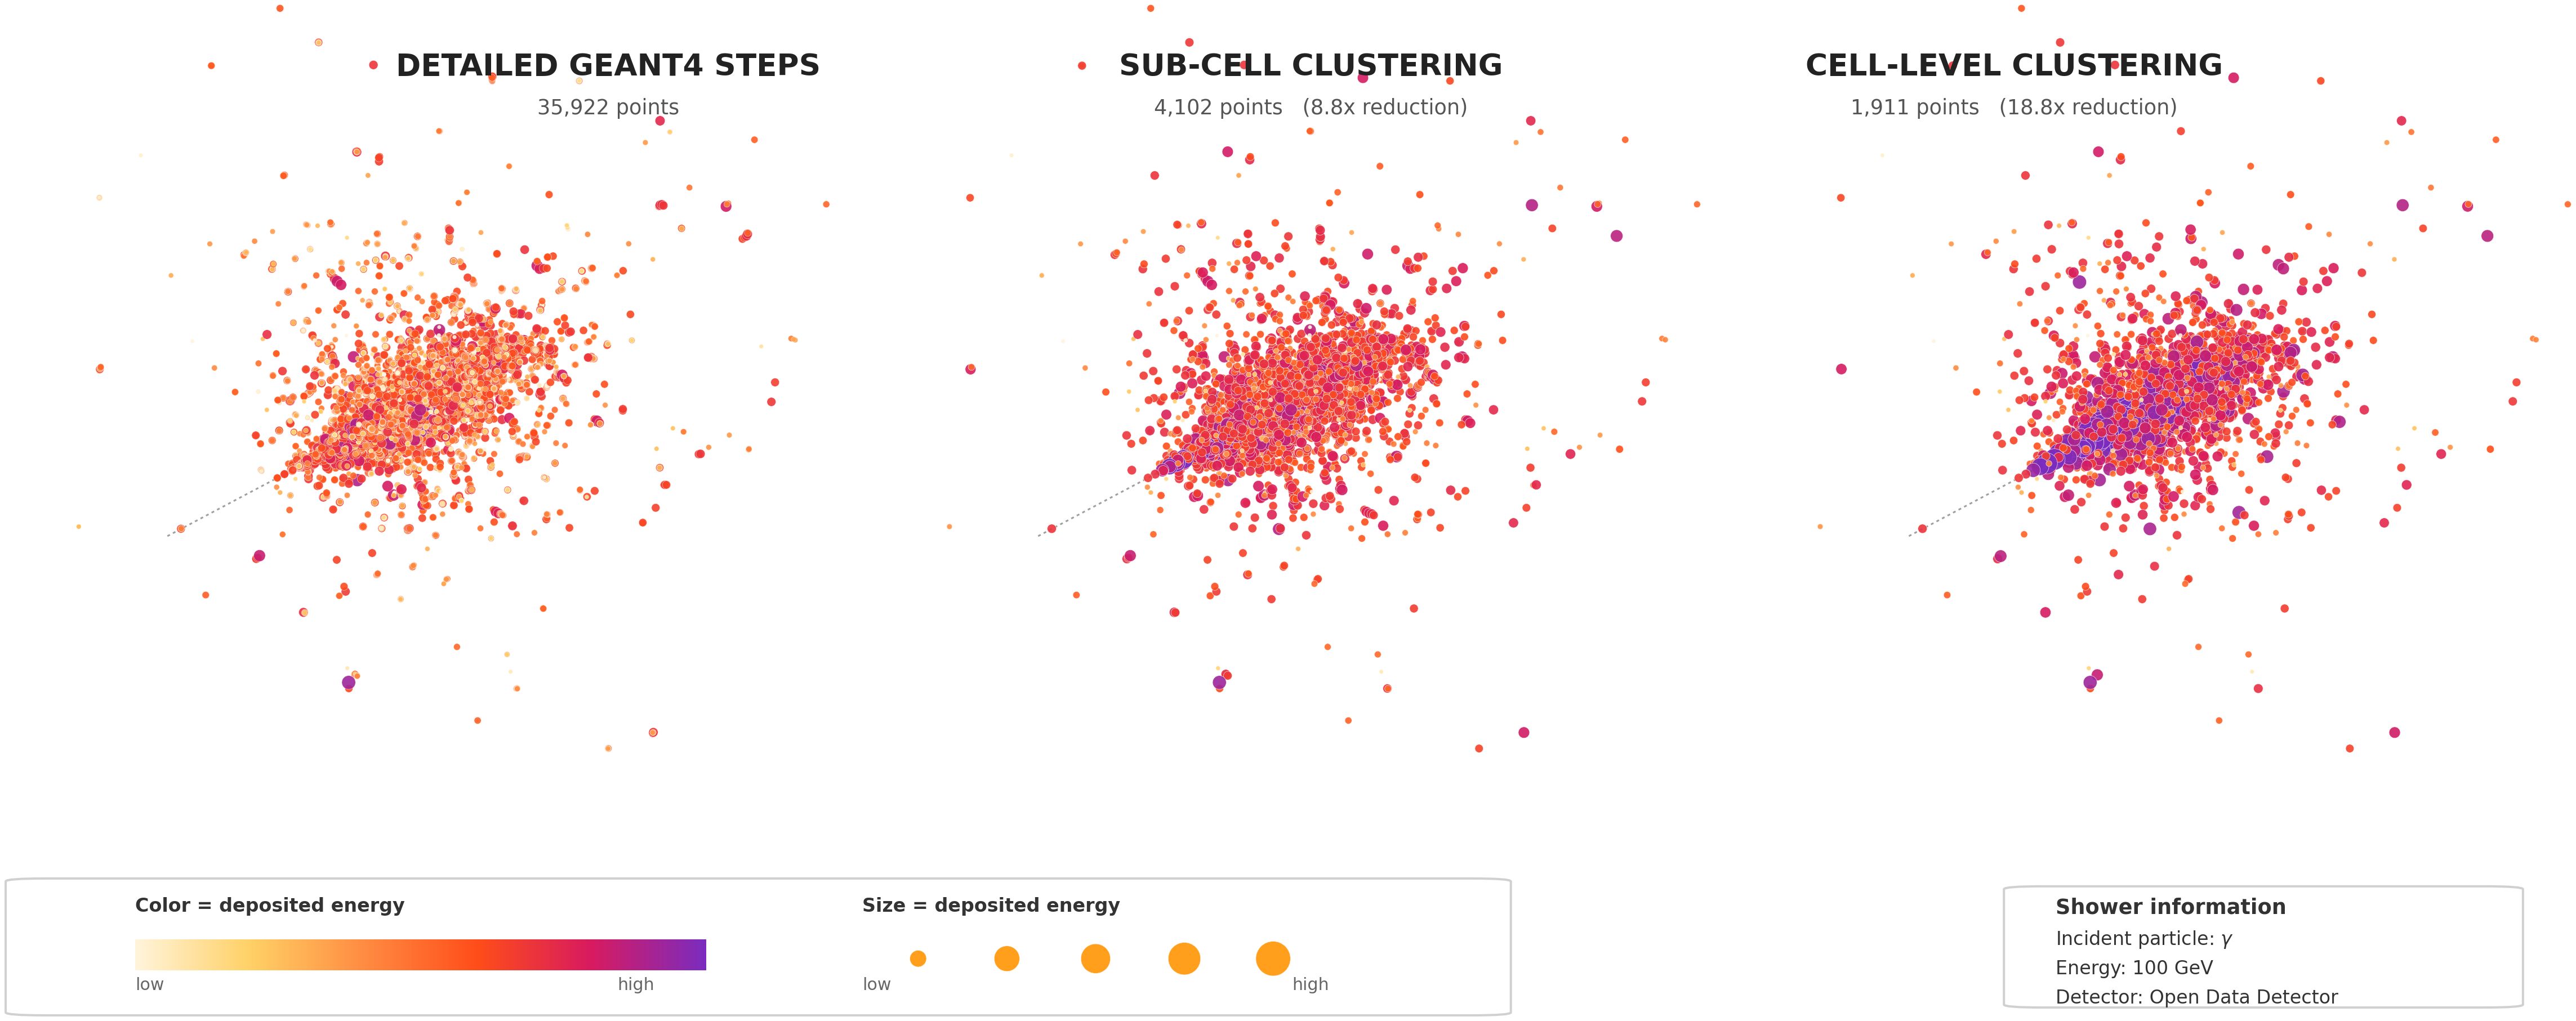
Motivation
Detailed Geant4 calorimeter simulation gives the most faithful picture of how showers develop in matter, but it is also too detailed to serve directly as a practical training representation for generative models:
- the step-level representation is large
- the voxelised representation is sparse
- the number of points is irregular from shower to shower
- detector geometry is non-trivial and hard to regularize cleanly
Existing approaches often start by very fine-granularity voxelisation and turn each non-empty voxel into a point, making not necessarily an optimal representation.
step2point is built around an idea:
Analyse the shower as a point cloud, reducing it to a smaller set of points in a way that respects calorimeter response.
Input/output
-
Input: detailed shower deposits
Shower:
x, y, z, E, optionallyt,cell_id, particle provenance, or detector metadata, ... -
Output: compressed point cloud shower
Shower represented with fewer points, keeping the same schema
x, y, z, E. -
Compression quality: physics validation
Compression is never a purely geometric simplification. Every algorithm should be judged by what it preserves and what it intentionally changes.
Compression quality
In step2point, a good representation is not just one with fewer points.
It should reduce complexity while preserving the observables that matter for calorimeter studies and later detector-level use. In practice in this library it means paying attention to:
- total deposited energy
- longitudinal shower development
- radial shower development
- azimuthal structure
- first and second moments of the shower
- detector-aware quantities such as cell-energy spectra when
cell_idis available
At the same time, some quantities are expected to change by construction, especially the number of points and the individual point-energy spectrum.
What changes — and what should stay stable
Point representation
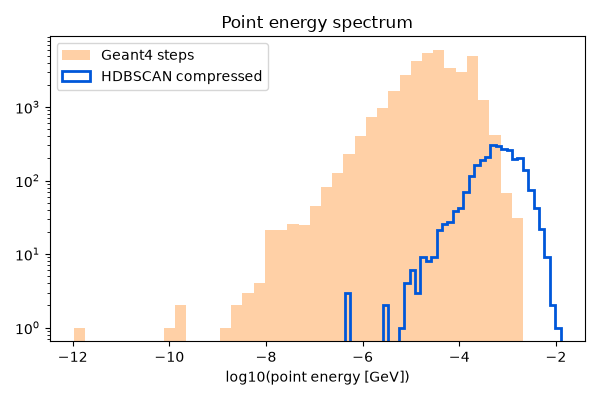
- point count and compression ratio
- individual point positions
- cluster assignments and representative cell IDs
Transverse shower structure
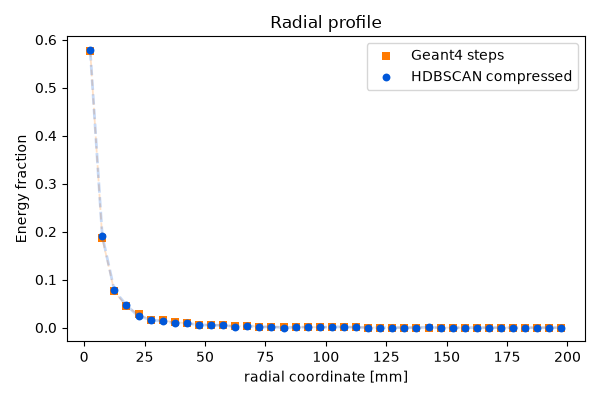
- total deposited energy
- longitudinal and time profiles
- energy-weighted centroids and moments
Real output from the HDBSCAN regression example in
test_algorithm_hdbscan_loose_regression.py;
regenerate it with the validation plotting workflow.
Quickstart
pip install -e .[dev]
pytest -q
See Getting started for a simple end-to-end Python example, and Future C++ backend for the planned path toward a shared C++ algorithm layer.